
Measuring Quality in Construction
Published January 9, 2015, Updated December 5, 2020
Background
In the construction industry, the successful and long-term implementation of quality programs has become more based and driven by key metrics. While there are no mandated metrics like safety, the quality industry has come a long way in the past 15 years on identifying and sharing key metrics.
A key focus of quality metrics has been to go beyond indicators of quality (number of punch list items, the number of requests for information, or the number of callbacks for projects), which are very subjective, to metrics that are comparable across projects and companies.
This has resulted in two fundamental categories of quality metrics: predictive (lagging) and preventative (leading).
Predictive Quality Metric
The industry has identified a single predictive quality metric to use – that of a Quality Incident, which is simply capturing an issue that occurred because the underlying quality process was not implemented fully. This concept is already the foundation of measuring our safety programs – any injury is unacceptable and indicates a failure of the overall “project safety process”.
In safety, there are less severe (recordable) and more severe (lost time) incidents. For quality, incidents range from less severe (items that occur during construction), to more sever (items that result in a claim).
What is a Quality Incident?
To be able to share data and information across the industry, it is important clearly define what a Quality Incident is. To keep it simple and adaptable across a wide range of companies, four primary categories have been identified for identifying a Quality Incident:
Key Information to Capture with Each Quality Incident
The value of a Quality Incident comes from using the data from all reported Quality Incidents to understand risk and trends within a company and across the industry. Therefore, there is key information which needs to be captured with each Quality Incident for company and industry analysis includes:
Additional information that is used for company level analysis includes:
Using Historic Data to Drive Quality Improvements
It is essential to gain value from the reporting of Quality Incidents, as it provides on-going feedback to those reporting that their efforts provide improvement. While many approaches have been tried[3], the most effective means of analyzing the data is to simply compare the aggregate cost and number of Quality Incidents by Work Category. This simple comparison is then graphed and displayed using a four-quadrant system, with the division lines being the 50 percentile of either Cost (vertical axis) or Number (horizontal axis):
In the construction industry, the successful and long-term implementation of quality programs has become more based and driven by key metrics. While there are no mandated metrics like safety, the quality industry has come a long way in the past 15 years on identifying and sharing key metrics.
A key focus of quality metrics has been to go beyond indicators of quality (number of punch list items, the number of requests for information, or the number of callbacks for projects), which are very subjective, to metrics that are comparable across projects and companies.
This has resulted in two fundamental categories of quality metrics: predictive (lagging) and preventative (leading).
Predictive Quality Metric
The industry has identified a single predictive quality metric to use – that of a Quality Incident, which is simply capturing an issue that occurred because the underlying quality process was not implemented fully. This concept is already the foundation of measuring our safety programs – any injury is unacceptable and indicates a failure of the overall “project safety process”.
In safety, there are less severe (recordable) and more severe (lost time) incidents. For quality, incidents range from less severe (items that occur during construction), to more sever (items that result in a claim).
What is a Quality Incident?
To be able to share data and information across the industry, it is important clearly define what a Quality Incident is. To keep it simple and adaptable across a wide range of companies, four primary categories have been identified for identifying a Quality Incident:
- Water Infiltration – a water event (weather, site, system) that resulted in effort to clean up or damage to existing construction.
- Missed Key Project Activity – any activity the project team committed to in their quality plan that they subsequently did not accomplish.
- Major Rework – any rework above a set value (say $2,500) that is an impact to the owner, design partners, contractor or trade partners.
- Failed Test – any test that fails for which the project team had expected to pass.
Key Information to Capture with Each Quality Incident
The value of a Quality Incident comes from using the data from all reported Quality Incidents to understand risk and trends within a company and across the industry. Therefore, there is key information which needs to be captured with each Quality Incident for company and industry analysis includes:
- Date of Incident
- Work Category – identify the scope of work with respect to the Quality Incident[1].
- Cost of Quality Incident – estimated order of magnitude cost for the Owner, Design Partners, Trade Partners and Contractor[2].
Additional information that is used for company level analysis includes:
- Category of Quality Incident
- Primary Cause of Quality Incident – identify what caused the Quality Incident, such as Workmanship, Coordination, Design, Inadequate Training, Manufacturing Defect, Plan/Shop Drawing Review, Shop Fabrication, Unknown Field Condition, etc.
- Implications to Schedule – estimated order of magnitude impact to the schedule.
Using Historic Data to Drive Quality Improvements
It is essential to gain value from the reporting of Quality Incidents, as it provides on-going feedback to those reporting that their efforts provide improvement. While many approaches have been tried[3], the most effective means of analyzing the data is to simply compare the aggregate cost and number of Quality Incidents by Work Category. This simple comparison is then graphed and displayed using a four-quadrant system, with the division lines being the 50 percentile of either Cost (vertical axis) or Number (horizontal axis):

The four quadrants of the chart are:
The simplicity of this chart is that it visualizes where the risk has been (Q4), allowing programs and training to be created to address and eliminate the issues/risk. The goal is to drive the Q4’s down and to the left – making them Q1’s.
As the CQEC has been collecting and sharing Quality Incident data since 2005, substantial understanding and mitigation of risk has occurred. The following graph shows all of the Quality Incidents reported for 2005-2020.
- Q1 – low number and low cost – not many of them and little consequence.
- Q2 – high number and low cost – a lot of them, but little issue.
- Q3 – low number and high cost – a high cost, but not many of them – these are typically claims and latent defects.
- Q4 – high number and high cost – a lot of them that cost a lot of money.
The simplicity of this chart is that it visualizes where the risk has been (Q4), allowing programs and training to be created to address and eliminate the issues/risk. The goal is to drive the Q4’s down and to the left – making them Q1’s.
As the CQEC has been collecting and sharing Quality Incident data since 2005, substantial understanding and mitigation of risk has occurred. The following graph shows all of the Quality Incidents reported for 2005-2020.
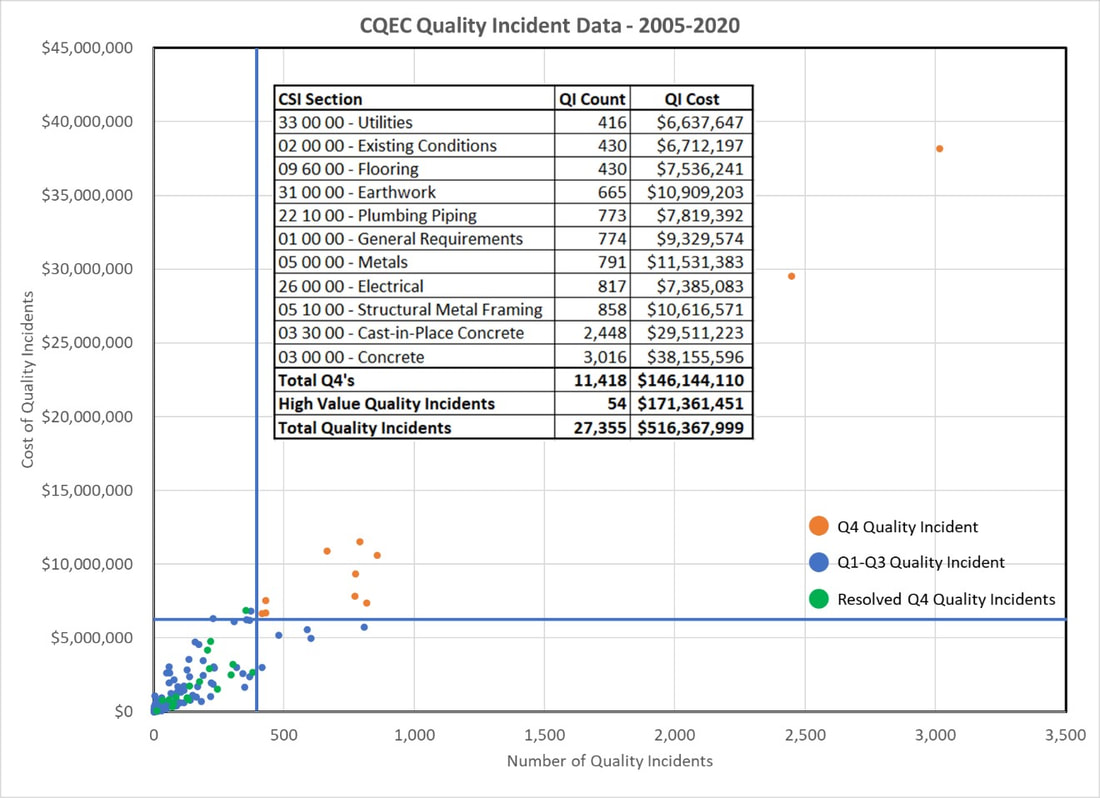
A key element of the Q4 analysis is that significant high value Quality Incidents are removed as they have been shown to be outliers – we still look at them, but not in the Q4 context.
The biggest value that can be seen in the chart are the Resolved Q4’s (green). These are categories that were Q4’s (e.g., building enclosure), but no longer are. It is estimated that these categories account for over $100 million in avoided costs by implementing focused programs in the CQEC member companies.
Looking at more recent data, the following chart provides the CQEC Quality Incidents for 2018-2019.
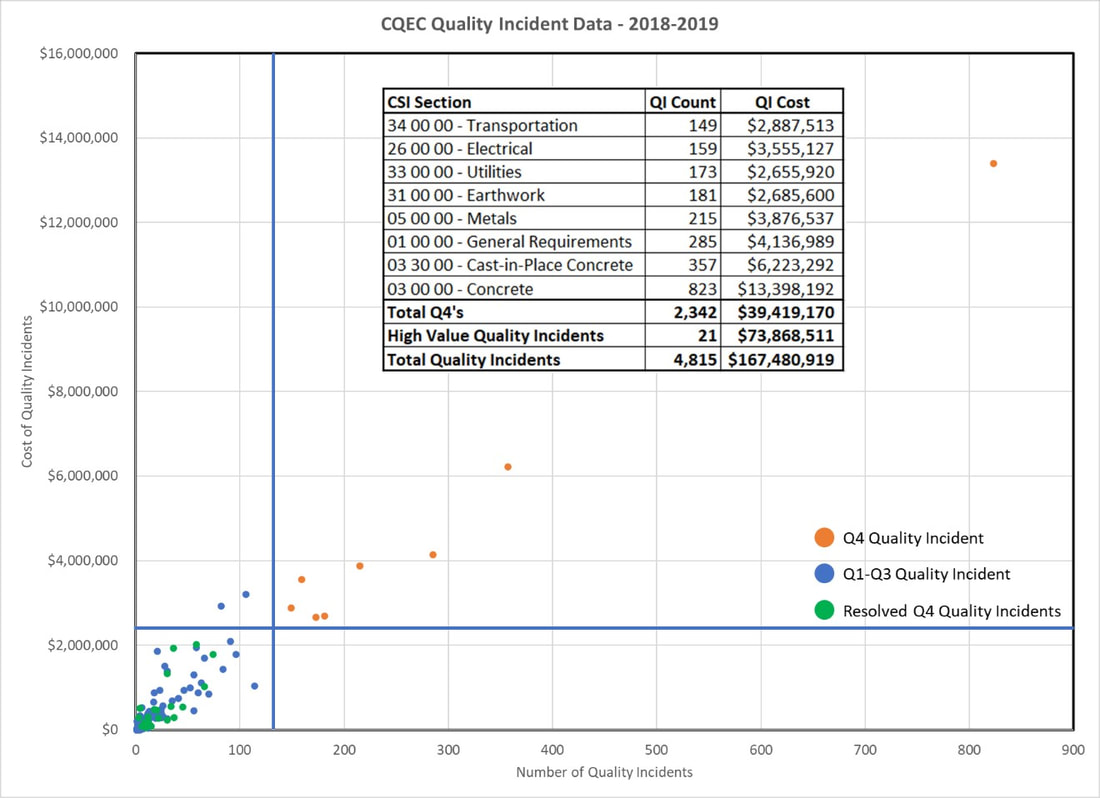
The Resolved Q4’s account for over $10 million in avoided costs for the past two years alone.
The Culture Change for Quality Incidents
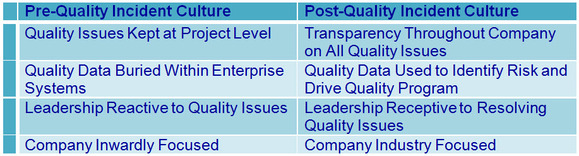
CQEC Member Companies have found that effort is required to get all projects to openly and honestly report their Quality Incidents, and that it typically takes 2-3 years to transition the company through the culture change. The following table highlights the key cultural changes required:
The Culture Change for Quality Incidents
CQEC Member Companies have found that effort is required to get all projects to openly and honestly report their Quality Incidents, and that it typically takes 2-3 years to transition the company through the culture change. The following table highlights the key cultural changes required:
In order to transition through the culture change, a company requires commitment and leadership to the change, along with clear messaging throughout the change to re-enforce expectations along with value to the individual and the company. The following are best practices to help a company through the Quality Incident culture change.
Ultimately, the more companies that transition through the Quality Incident Culture Change, the more information we will be able to share across companies and continuously improve our industry.
The Link Between Quality and Safety
Early in the development of the Quality Incident reporting structure, several CQEC member companies identified the need to track both quality and safety the same way - both categorize the incident by CSI Section. This enabled a quick understanding of where quality and safety incidents aligned or were different.
From an early analysis of the quality and safety data, it was apparent that where there were quality incidents (CSI Section), there were safety incidents - they tracked almost identically. In order to understand the linkage better, the early adopters of Quality Incident reporting added a question to safety incidents, requiring the reporters identify if the safety incident occurred while doing rework.
With three year's of data, the results were quite remarkable - within these companies, approximately 80% of the safety incidents that occurred happened while doing rework! The one caveat to this is that the companies being tracked had both world-class quality and safety programs, so their safety incident rates where often well below 1.0.
The result is that can be drawn from this is that rework is inherently more dangerous - you have to put it in, take it out, and put it back in again. For these best in class companies, the best way to reduce safety incidents was to focus on eliminating rework, or at least properly planning and executing the rework when it was required.
Preventative Quality Metrics
A more recent focus of the CQEC has been on preventative metrics that help understand how a quality program is performing – at the project and company level. These metrics allow for companies to get ahead of issues before they occur.
The task of identifying, collecting and analyzing preventive quality metrics has become increasingly easier with the increased use of cloud-based construction management systems, paired with business intelligence applications – essentially big data for quality.
There are two primary focuses for preventative quality metrics:
More to come on preventative quality metrics.
Footnotes:
[1] Recommend reporting Work Category by the primary CSI Specification Section impacted by the Quality Incident.
[2] The order of impact could be tracked by estimated dollar value and/or man-hours to evaluate and correct the Quality Incident.
[3] Approaches include comparison of costs, numbers, severity, timing of Quality Incident and project type.
- Leadership – the primary success factor to making Quality Incident Reporting part of your culture is the engagement of senior leadership within the company. The CEO, COO and Operational Leaders need to commit to the need for reporting and actively engage in discussing the results. In addition, there needs to be a company champion (i.e. Company Quality Leader) that drives the reporting, including training, reporting and program improvements.
- A High Rate is Good – as the Quality Incident Reporting gets started, it is essential that leadership and individuals recognize and promote that a high Quality Incident Rate is good, in that it represents projects being honest and open to reporting their issues. Any negative reaction to reporting will result in delays to changing the culture – address the issue, don’t berate the reporter.
- Exceptions are Bad – conversely, it needs to be clearly communicated that not reporting is bad. The best way to do this is through the Preventative Quality Metric Exception Report introduced earlier – by having leadership agree that any project not reporting a Quality Incident every “x months” is unacceptable and results in an exception to be addressed.
- Lessons Learned – the key to improvement is avoiding repeating past mistakes. Therefore, sharing of key and repetitive Quality Incidents from the company to all employees is critical. This could be through newsletters, on-going training, or formal knowledge sharing systems.
- Analysis Leads the Way – the last step in culture change is clearly communicating the value to leadership and employees. This is accomplished through analysis, program improvement and more analysis – use the Q4 concept introduced earlier.
Ultimately, the more companies that transition through the Quality Incident Culture Change, the more information we will be able to share across companies and continuously improve our industry.
The Link Between Quality and Safety
Early in the development of the Quality Incident reporting structure, several CQEC member companies identified the need to track both quality and safety the same way - both categorize the incident by CSI Section. This enabled a quick understanding of where quality and safety incidents aligned or were different.
From an early analysis of the quality and safety data, it was apparent that where there were quality incidents (CSI Section), there were safety incidents - they tracked almost identically. In order to understand the linkage better, the early adopters of Quality Incident reporting added a question to safety incidents, requiring the reporters identify if the safety incident occurred while doing rework.
With three year's of data, the results were quite remarkable - within these companies, approximately 80% of the safety incidents that occurred happened while doing rework! The one caveat to this is that the companies being tracked had both world-class quality and safety programs, so their safety incident rates where often well below 1.0.
The result is that can be drawn from this is that rework is inherently more dangerous - you have to put it in, take it out, and put it back in again. For these best in class companies, the best way to reduce safety incidents was to focus on eliminating rework, or at least properly planning and executing the rework when it was required.
Preventative Quality Metrics
A more recent focus of the CQEC has been on preventative metrics that help understand how a quality program is performing – at the project and company level. These metrics allow for companies to get ahead of issues before they occur.
The task of identifying, collecting and analyzing preventive quality metrics has become increasingly easier with the increased use of cloud-based construction management systems, paired with business intelligence applications – essentially big data for quality.
There are two primary focuses for preventative quality metrics:
- First In Place Quality – this metric evaluates the quality of the work being put in place to determine the percent correct. Typical best in class have a first in place quality around 98%.
- Quality Program Health – the ultimate goal is to use multiple data sources from a project to determine the projects quality program health. This will require determining baselines and best in class for such items as:
- Creation and upkeep of living quality plans
- Submittal cycle times and number of cycles
- RFI cycle times and number of cycles
- Verification first in place quality
More to come on preventative quality metrics.
Footnotes:
[1] Recommend reporting Work Category by the primary CSI Specification Section impacted by the Quality Incident.
[2] The order of impact could be tracked by estimated dollar value and/or man-hours to evaluate and correct the Quality Incident.
[3] Approaches include comparison of costs, numbers, severity, timing of Quality Incident and project type.
The Construction Quality Executives Council (CQEC) is an industry organization composed of Quality Leaders from design and construction firms with formal Quality Programs. The goal of the CQEC is to advance the art and science of quality in the built environment through publications, education and research. The information and views expressed is that of the CQEC and not that of the member’s company. This document is copyrighted (2020©) and the CQEC grants permission to reproduce and distribute as long as credit to the source document and CQEC is maintained.